Set up full stack observability
Set up log aggregation with Elastic and Scale out Prometheus with Victoria Metrics
Setting the Stage
If you're actually going to use this infrastructure in earnest, you'll need some form of monitoring and observability. Plural integrates directly with a number of observability providers, but the easiest and cheapest to get going quickly is to use our most streamlined setup, namely:
- Victoria Metrics - a scale-out, prometheus-compatible time series datastore, with a feature rich agent, vmagent. This gives you unified metrics observability
- ELK stack - handles log aggregation and search, and integrates directly with the Plural Console. It also doubles as a vector store if you wish to use some of our advanced AI functionality.
We already have a few streamlined setups in our service catalog to do this, you'll want to go to Catalogs -> devops (can do this with Cmd + K -> Catalog, or just use the sidebar), from there you should see a page like this:
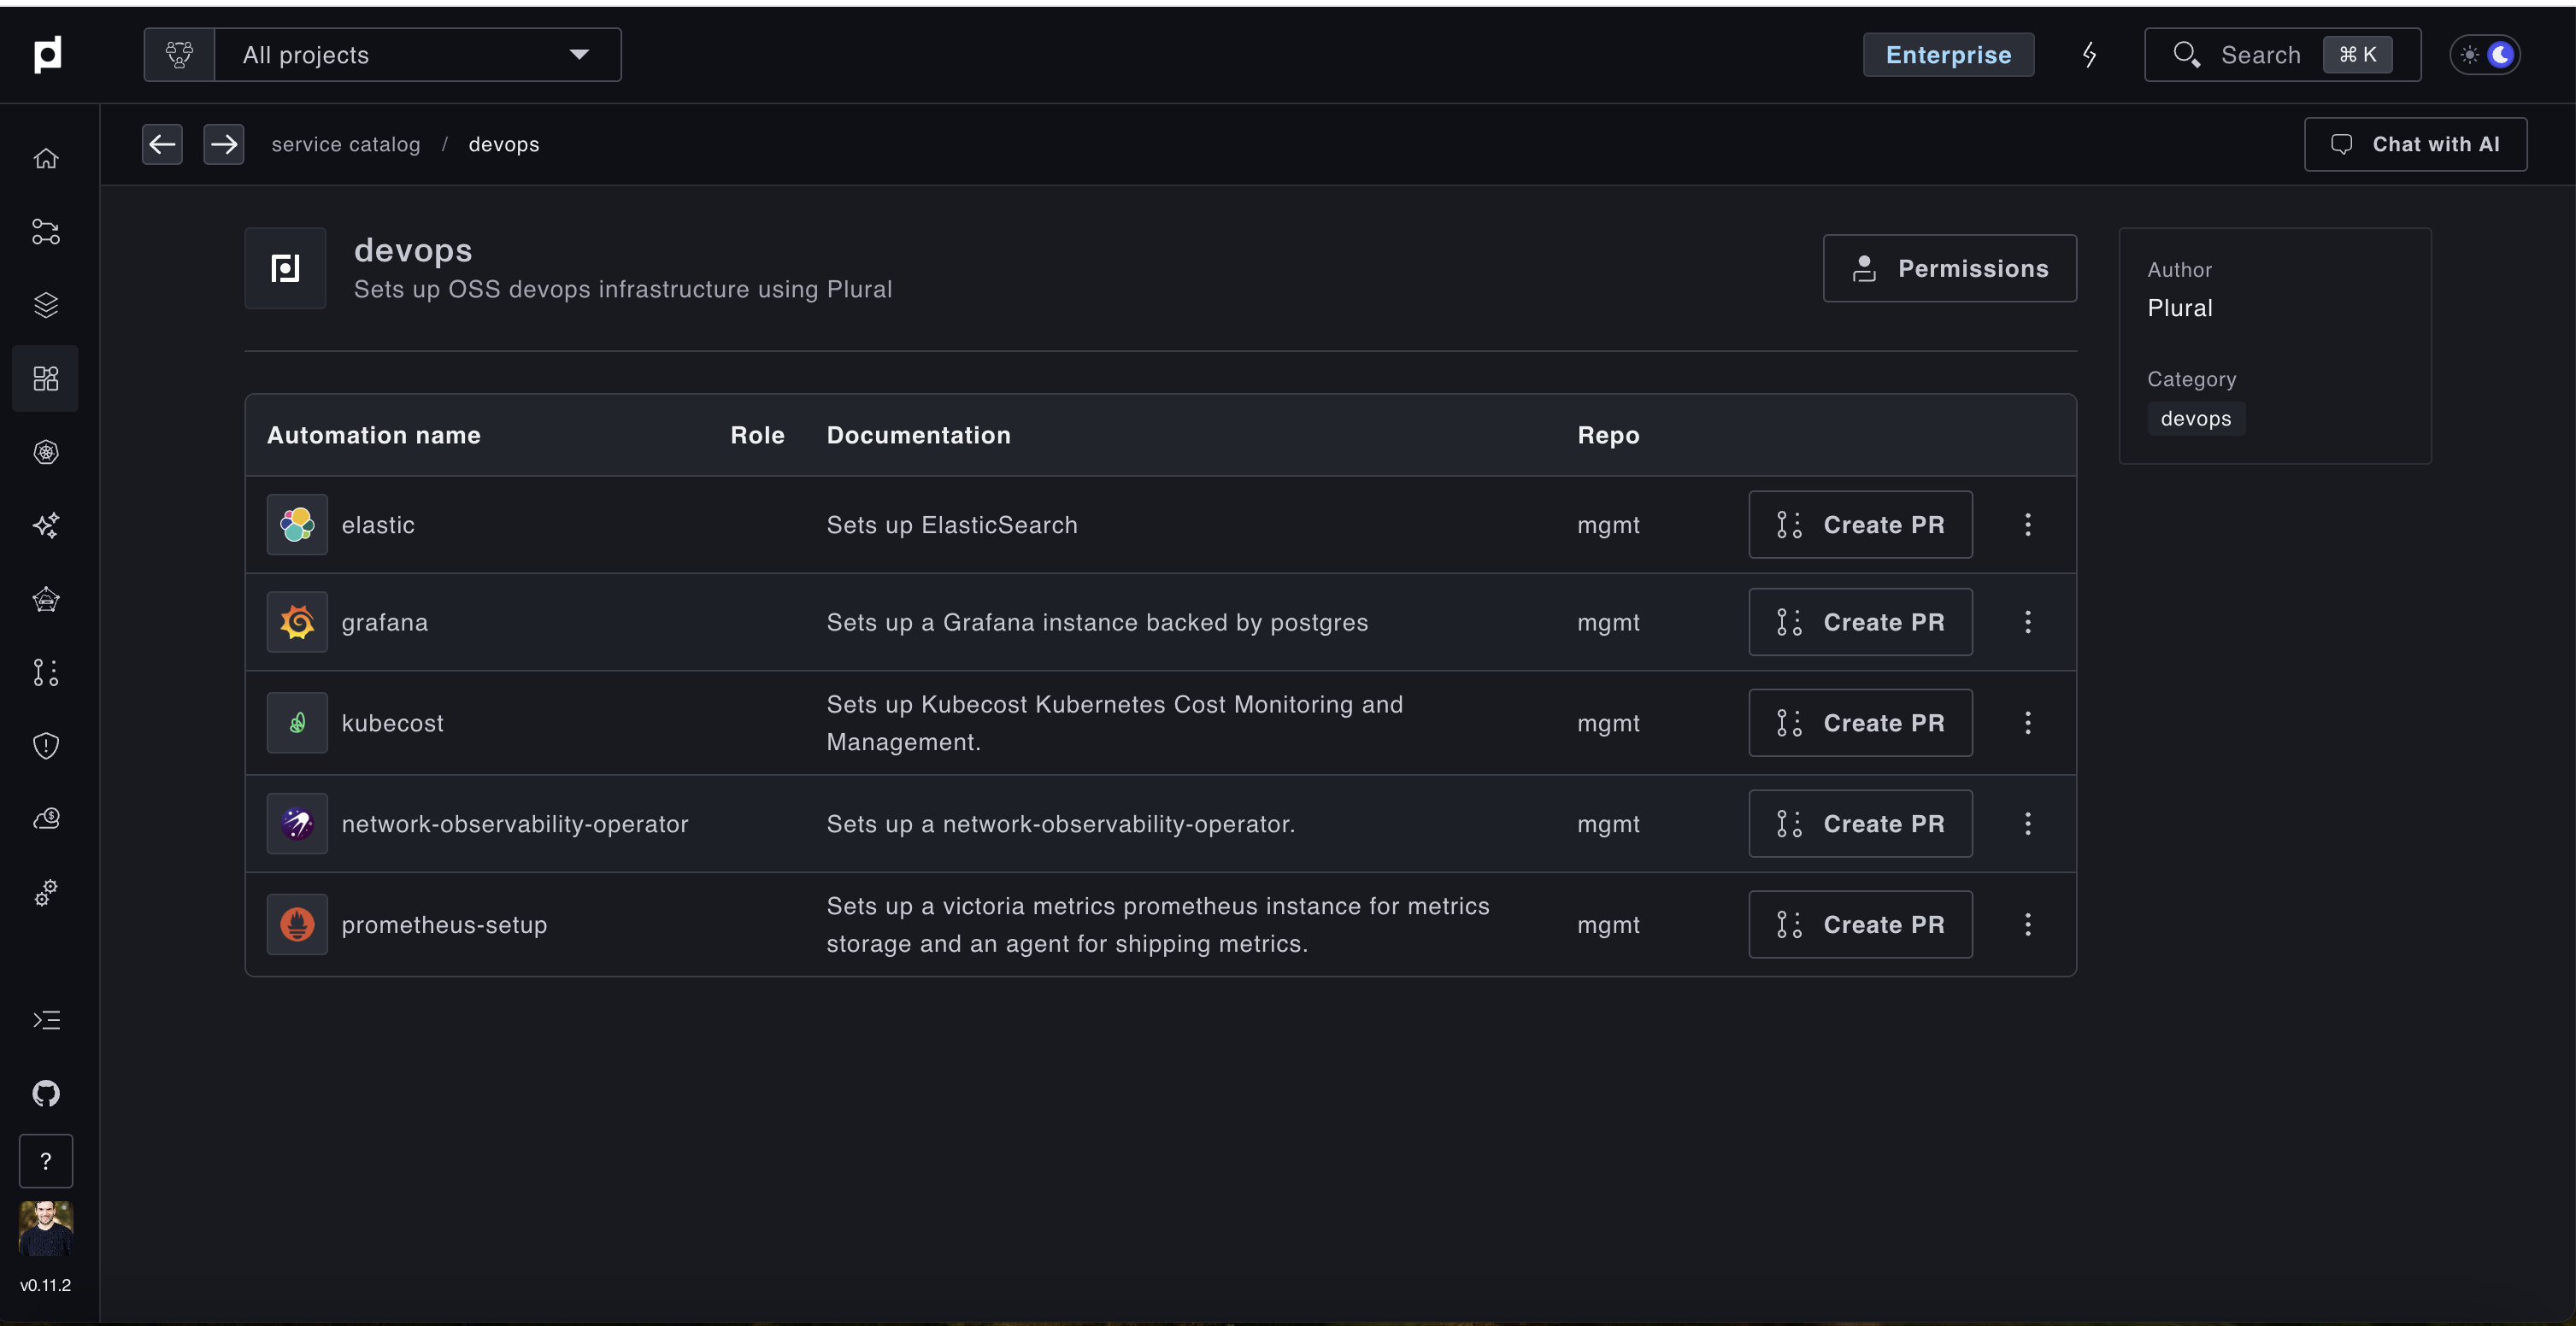
Go through the wizards for both elastic and prometheus-setup. When they ask you to select a cluster, be sure to chose a cluster which has an actual load balancer and externaldns configured, as both expose a HTTP api that needs to be externally queried.
We recommend deploying both to the same cluster for ease of maintainence, your workload clusters will likely have everything, or you can configure the mgmt cluster to support load balancing as well and deploy them there.
Info:
For elasticsearch as well, we recommend using a decently large disk, between 100 - 200Gi as log data can be large. You can also resize these post-hoc and expand the number of replicas in your cluster. Most elasticsearch operations are managed entirely by the ECK kubernetes operator post-deploy.
What this configures and confirm its working
Both these PR automations will deploy in total: